Spice up your designs with charts!
Designing dashboard, reporting or analytics screens? Here’s a good news for you: Visily now includes Pie Chart, Line Chart, and Column / Bar Chart as our latest smart components.
You can easily drag and drop then customize their styles, series, legends and more to your liking.
Sneak peek: table component is coming soon! Stay tuned!
More templates in various categories
Explore the newly designed template library with hundreds of templates for web apps, website and mobile apps. Navigate quickly by selecting the relevant categories, such as landing page, login-sign up, settings and more.
What’s more, check out the “Inspirations” sections to find templates of some specific apps, designed by professional designers!
See more guides and tips about Templates here.
Ensure visual consistency with Copy Formatting
Tip to speed up your design: You edit a component and want other components to follow the same style? Simply select that component, press Cmd Shift C (or Ctrl Shift C on Windows), and click on any other components to paste the exact styles.
More smart component customization
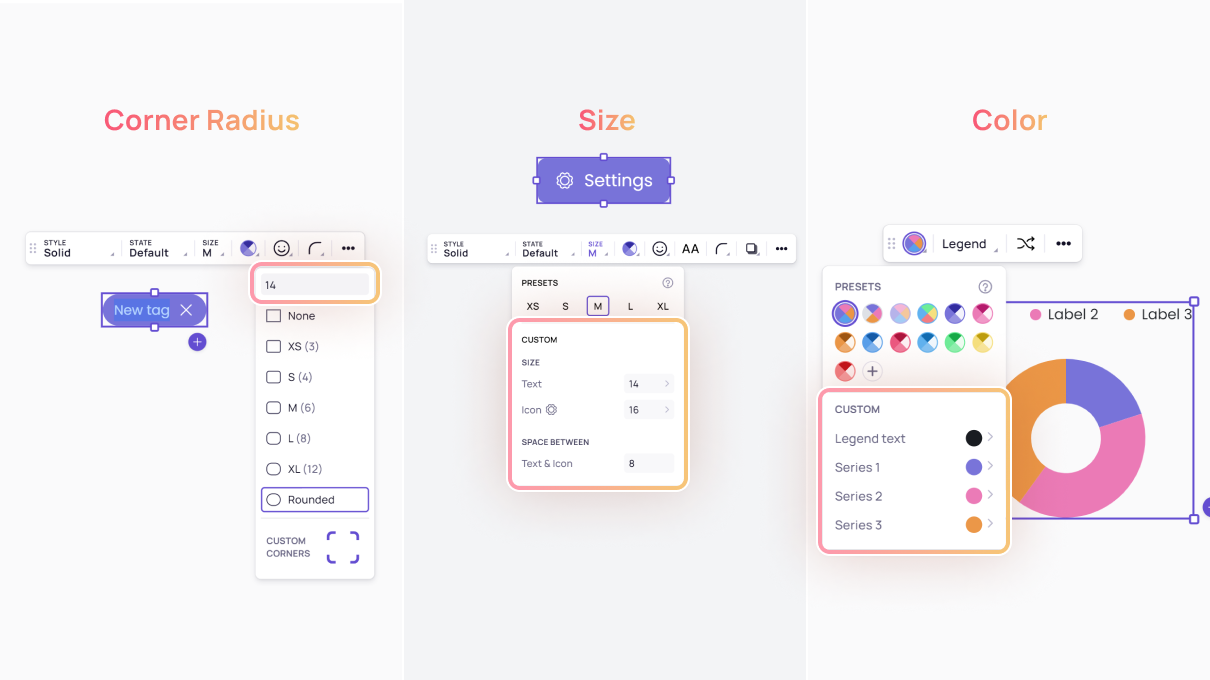
You have asked for more fine-grained control over colors, sizing and corner radius of smart components. With the new version, you can input specific values for these properties.
Tip: If you want to input specific width and height or space between multiple elements at once, try the Layout Properties panel on the right side. See guides here.

Faster loading and design editing
We’ve heard you – your Visily boards become bigger and Visily becomes laggy. We’ve made improvements to the app performance, so you can expect faster load time and design editing. This is just a start, we’re hard at work to make sure that Visily will stay snappy when your app grows.

Major bug fixes
We’ve made these improvements to the app:
- Improved the experience on Safari
- Fixed various issues related to layer ordering


