Navigating the intricate landscape of product management requires more than just words—it demands clear visuals. Diagrams and flowcharts are indispensable for conveying complex ideas and streamlining processes within teams. In this article, we’ll explore five essential diagram templates that every proficient product manager should have in their toolkit. Let’s dive in and discover how these templates can elevate your product management journey.
Key Takeaways
- Diagrams are essential tools for product managers, serving unique functions like outlining hierarchies and workflows, comparing data, or presenting complex information visually and engagingly.
- Diagram templates are pre-designed frameworks that facilitate the creation of diagrams, assisting in visual storytelling and saving time with their preset shapes, symbols, connectors, and text placeholders.
- Product managers benefit from diagram templates like User Flow Diagrams, Swimlane Diagrams, Site Maps, Daily Standup, and Start-Continue-Stop Retrospective which aid in effective communication, project planning, and prioritization.
Diagram Templates Every Product Manager Should Use
In product management, various types of diagrams, including tree diagrams, play crucial roles in clarifying ideas, structures, and processes. Whether you’re utilizing:
Tree diagrams to map out hierarchies
Process diagrams to outline workflows
Venn diagrams for comparison and contrast
Bar diagrams for data presentation
Each type of diagram fulfills a specific function.
Choosing an appropriate diagram template is vital to accomplish this purpose and optimize your data visualization. With a diverse range of templates available, you can visualize concepts, relationships, and structures in a way that’s not only comprehensive but also engaging. Beautiful, clear, and shareable, these templates are an invaluable resource for every product manager.
Definition of Diagram
At its core, a diagram is a simplified visual representation of information. It’s a means of taking complex data and turning it into a visual narrative that’s easy to understand and interpret. But what makes up a diagram?
Diagram templates are pre-designed layouts that serve as a starting point for creating specific kinds of diagrams. They typically include:
- Shapes and symbols, which represent the core elements of the diagram, such as boxes for processes in a flowchart or circles for people in a user persona template
- Connectors like lines or arrows, show relationships between these shapes and symbols
- Text placeholders, are designated areas for you to add specific information relevant to your situation.
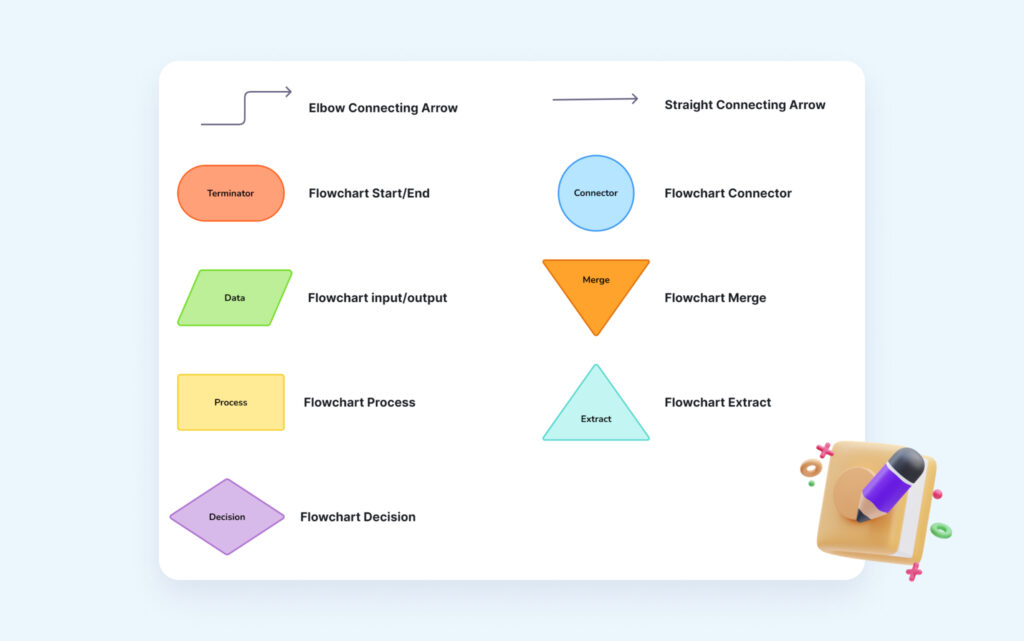
Using diagrams diagram templates can save you time and effort in creating professional-looking diagrams templates. Essentially, diagram templates provide the framework for constructing your visual narrative.
Importance of Diagrams in Product Management
Diagrams, including bar diagrams and pie charts, are useful tools that can greatly enhance your product management efforts. They streamline communication by turning complex ideas into understandable visuals, making sure everyone involved is on the same page.
By visualizing information, diagrams:
- Help identify problems and opportunities, leading to better product choices
- Create a shared understanding of the product’s goals, ensuring everyone is working towards the same vision
- Serve as problem-solving powerhouses, uncovering issues and exploring solutions before they become roadblocks
- Save time by presenting information concisely, boosting efficiency across the board
Key Diagram Templates for Product Managers
As a product manager, mastering the use of certain diagram templates can significantly enhance your effectiveness. In this blog, we’ll cover:
User Flow Diagrams
Swimlane Diagrams
Site Maps
Daily Standup
Start-Continue-Stop Retrospective
We will explore each of these in detail to understand their role in effective communication and project planning.
User Flow Diagrams
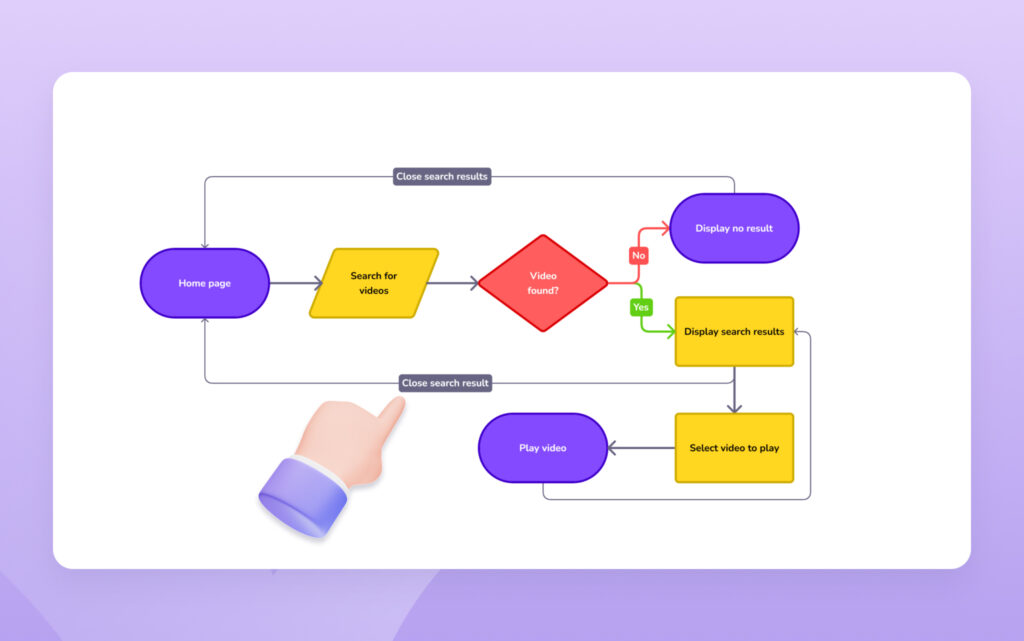
User flow diagrams are integral tools in product management, offering a structured visual representation of the user journey within a digital product or platform. Think of them as navigational maps, illustrating the sequential progression of user interactions, decisions, and pathways.
These diagrams serve a dual purpose: aiding in strategic planning and facilitating effective communication among stakeholders. They provide product managers with a comprehensive overview of user interactions, allowing for meticulous planning and optimization of the user experience.
User flow diagrams are crucial in meetings and discussions, offering a clear picture of the planned user experience and ensuring everyone is on the same page. With different diagram template types, product managers can efficiently analyze user scenarios, identify issues, and enhance the user journey for better engagement and satisfaction.
Swimlane Diagrams
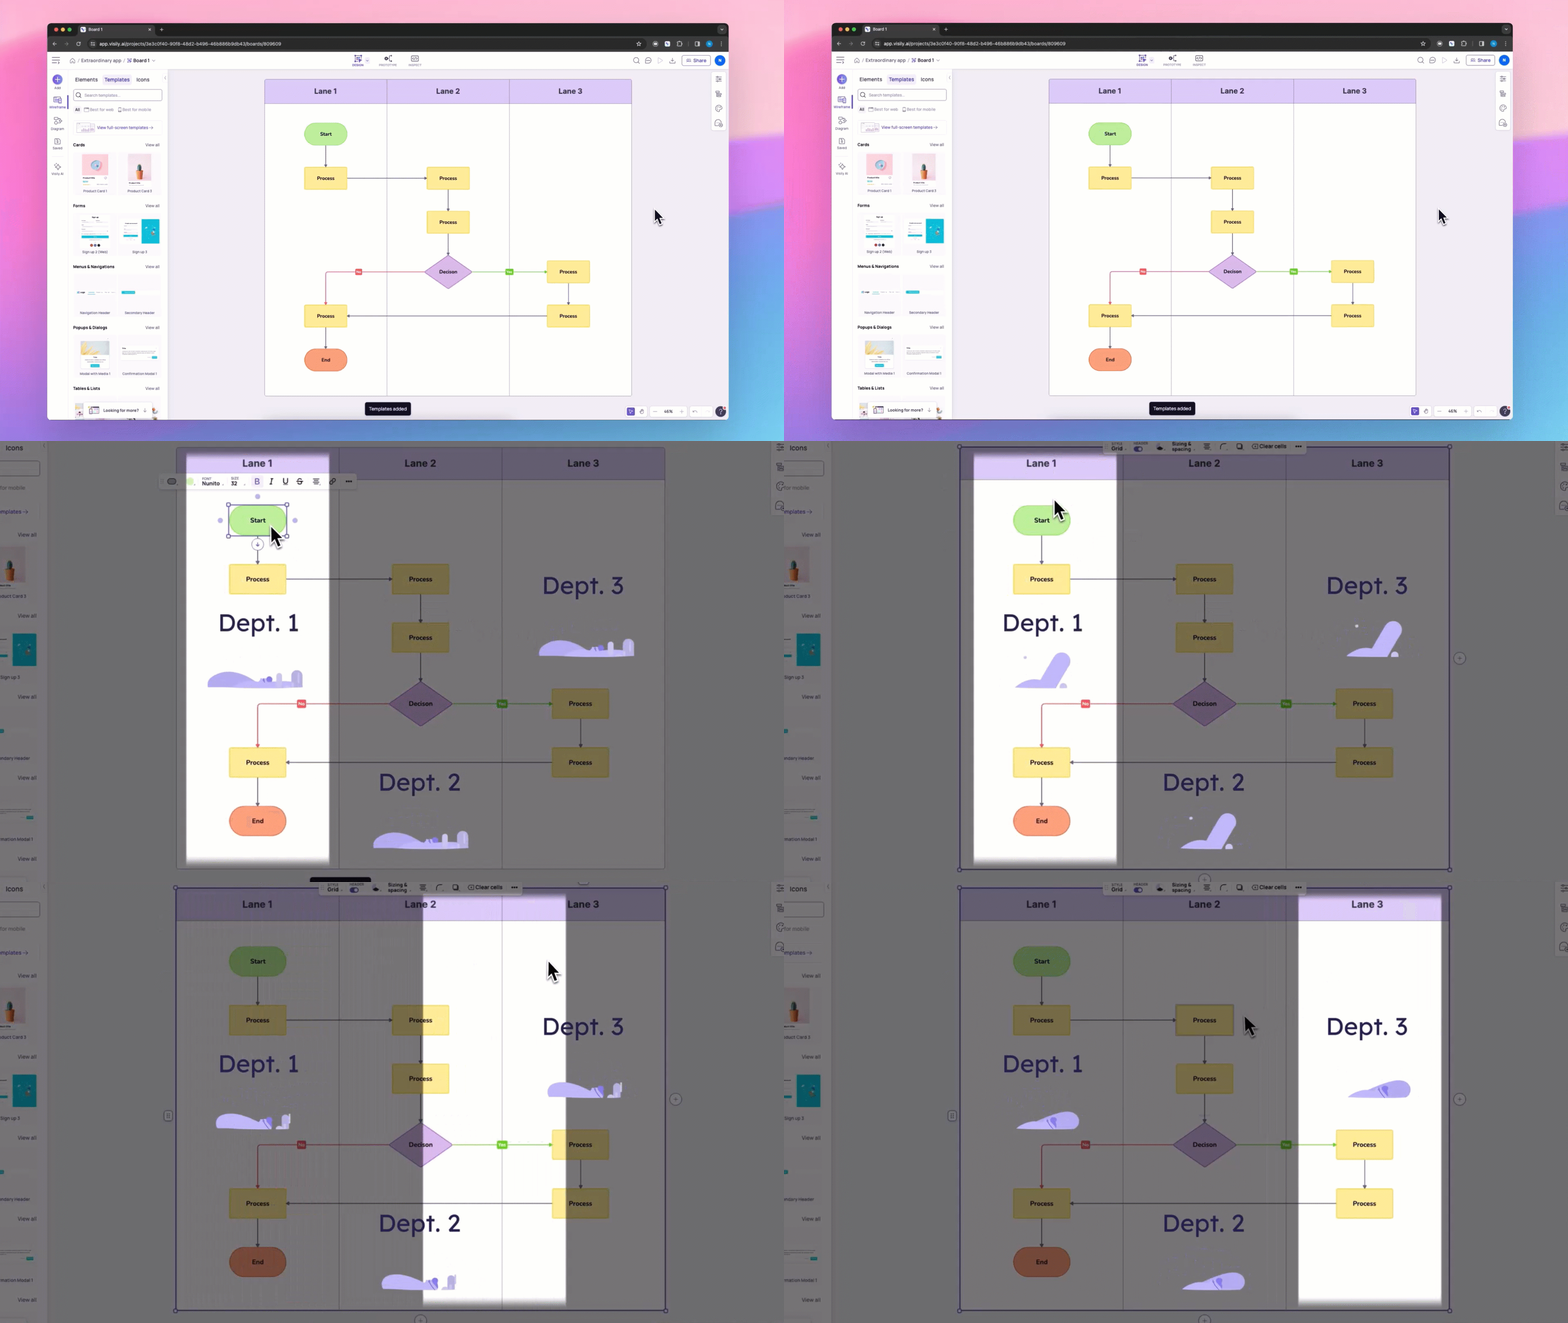
In product management, business processes can often involve multiple roles or departments. That’s where Swimlane Diagrams come in. They organize process flows into lanes based on roles, departments, or stages, clearly delineating responsibilities and handoffs in complex workflows.
When confusion arises about individual responsibilities within a specific stage of an overall process, a swimlane diagram can quickly clarify matters. Swimlanes are commonly utilized in product management for tasks that involve different departments, providing a visual breakdown of roles and responsibilities.
By enhancing understanding and streamlining process optimization, Swimlane Diagrams serve as a visual guide to your product’s processes, ensuring everyone knows their role and how they fit into the larger picture. It’s like having a map of your product’s workflow, providing clarity and direction to your team, resulting in better communication.
Site Maps
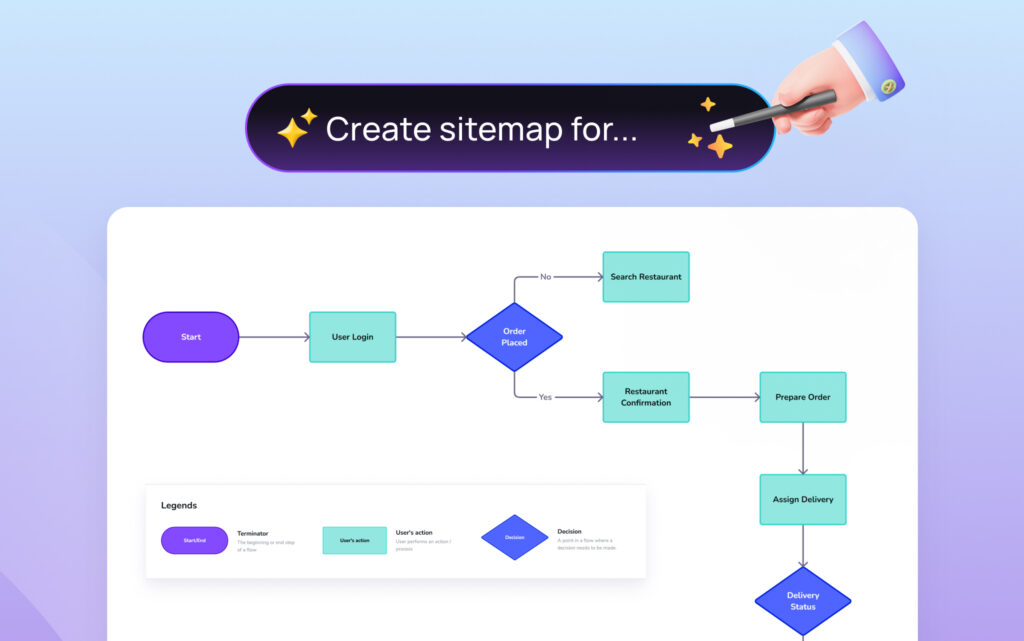
For product managers working on websites or apps, a site map is a must-have. It visualizes the information architecture of a website or app, illustrating the connections between all pages and sections.
By helping users navigate and understand the overall structure of the site or app, a site map ensures that your digital product is user-friendly and intuitive. It’s like a city map guiding search engines and visitors to their desired destinations.
To streamline the creation process of site maps, consider leveraging AI technology. Visily offers a Text-to-Diagram AI feature, allowing you to effortlessly generate a site map based on your text input, thereby simplifying the creation of a polished diagram template.
Daily Standup
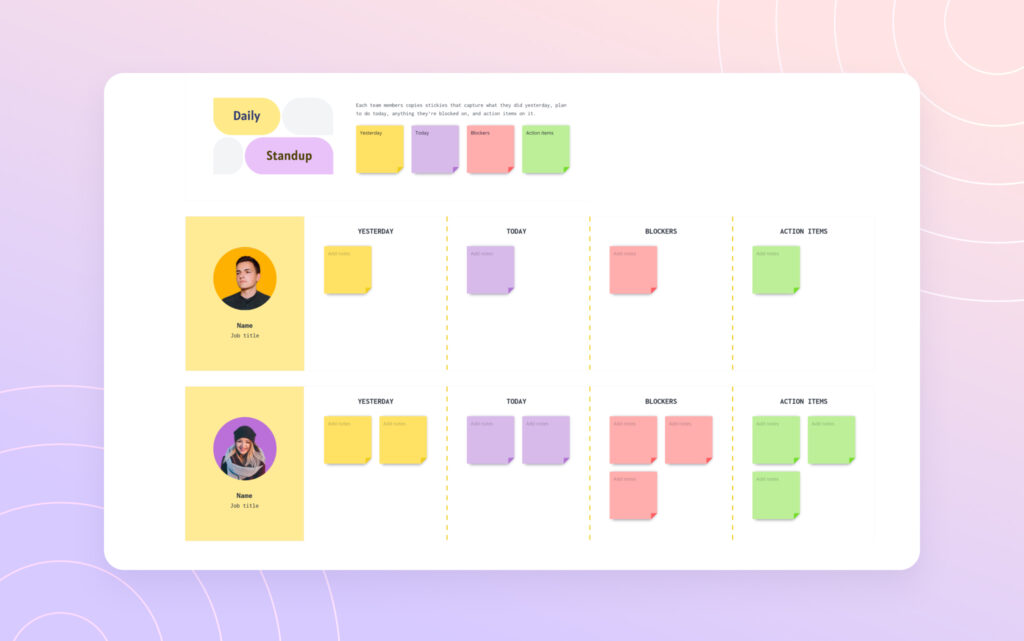
The Daily Standup Diagram Template is a useful tool that helps agile teams streamline their daily meetings. Teams can use this template to capture critical key points throughout meetings, offering a clear visual for tracking the process and addressing any issues. Each section of the template corresponds to major aspects of the daily standup: yesterday’s achievements, today’s goals, and any obstacles or tasks that require attention.
With its focus on simplicity, the diagram template ensures discussions stay concise and productive, akin to standing meetings designed to keep things moving. Promoting transparency and alignment, the Daily Standup diagram template empowers teams to tackle issues early and boost overall effectiveness. Whether teams use it in physical or digital form, this template actively facilitates the structured management of daily standup meetings, fostering project success.
Start-Continue-Stop Retrospective
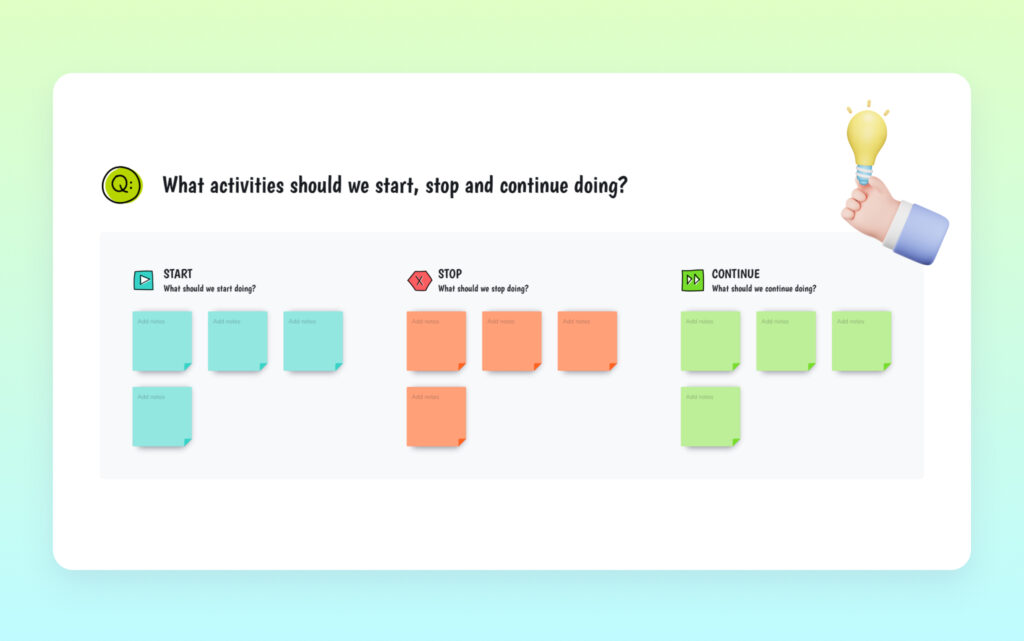
The Start-Stop-Continue Retrospective actively engages agile teams in reflecting on their work through a self-explanatory and action-oriented technique. Participants collaborate in three categories: “Start” for new practices to adopt, “Stop” for practices to abandon, and “Continue” for practices to maintain. This structured brainstorming session fosters open discussion and constructive feedback, facilitating the identification of areas for improvement.
The Start-Stop-Continue Retrospective enables team members to share their perspectives and insights. Based on this input, the team can then create concrete action plans. This collaborative approach ensures that the team can capitalize on successful practices while addressing and eliminating those that hinder progress. Ultimately, the retrospective empowers the team to continuously refine their processes and adapt to changing circumstances, improving efficiency and effectiveness in subsequent cycles.
How to create a beautiful diagram?
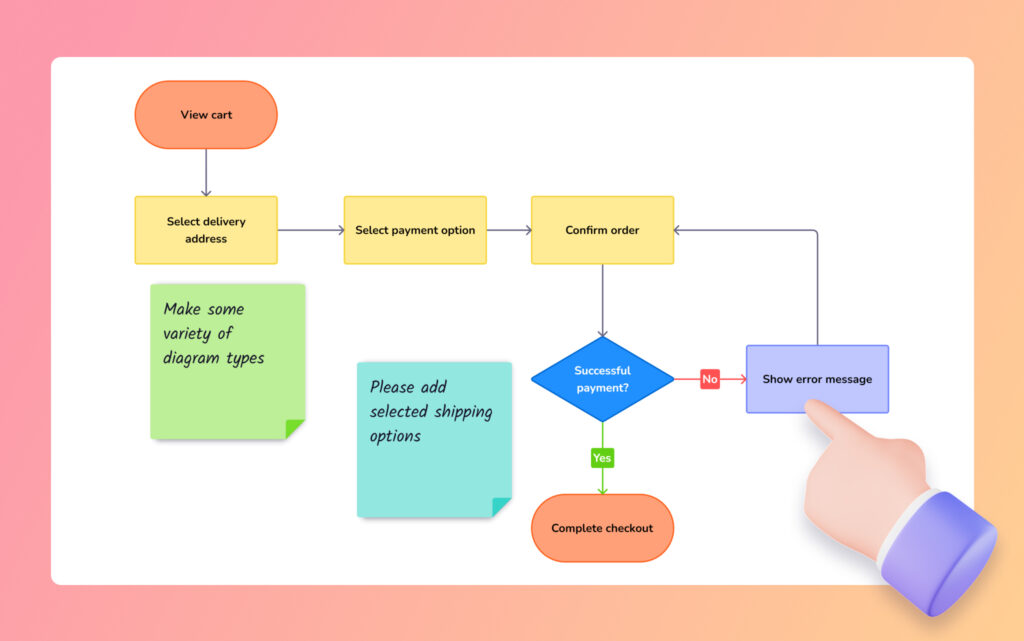
Although the conveyed information is crucial, the manner of presentation can significantly affect their reception. This is where the art of design comes into play. By incorporating design elements like shapes, icons, arrows, colors, and fonts, and applying visual design principles like contrast, balance, emphasis, and repetition, you can take your diagrams to the next level.
Utilize design elements
In diagramming, shapes, icons, and arrows constitute the building blocks of your visual narrative. They’re the fundamental design elements that differentiate sections, illustrate connections, and emphasize important points within the diagram.
So, what’s the effective way to use these elements? Arrows can indicate flow or direction, icons can represent concepts or actions, and shapes can denote boundaries or groupings. Platforms like Visily provide a comprehensive library of these elements, ensuring consistency and impact across various types of diagrams, making each one both informative and visually engaging.
Use consistent styling
Ensuring consistency in styling is essential for creating clear and professional diagrams. This means using the same colors, fonts, and design styles throughout your visuals. Complementary colors offer high contrast and can be used to enhance readability and highlight important details in diagrams. Similarly, using uniform fonts and design styles contributes to readability and professionalism.
Such consistency serves a dual purpose: it enhances visual coherence and professionalism while facilitating clear communication of information.
Incorporate visual elements
To further enhance your diagrams, consider adding relevant images, icons, or vector graphics, alongside numerical data. These additional components can make your diagrams more engaging and visually support the information presented. Adding sticky notes along the way can further elaborate complex ideas, providing the audience with a more detailed understanding. However, be mindful not to overcrowd the diagram, keeping it balanced and visually appealing.
Diagram Templates for Specific Business Needs
Each business is distinctive, as are its diagramming requirements. Whether you’re illustrating cyclical processes with circular infographics, comparing and contrasting with Venn diagrams, or outlining organizational structures with organizational charts, there’s a diagram template for every scenario.
Visily diagram templates are fully editable, allowing you to customize them for your unique business scenarios. With formats tailored for different types of diagrams, you can choose the best template for your specific needs, ensuring your diagrams are as effective as possible.
Explore more diagram template types in this Audio blog: Effortless Design with Visily: A Walkthrough of Diagram Templates (Pt. 1)
Stay tuned for part 2 where we hand-pick some more useful diagrams for Product Managers and Business Analysts alike 😎.
Collaborating on Diagrams with Your Team
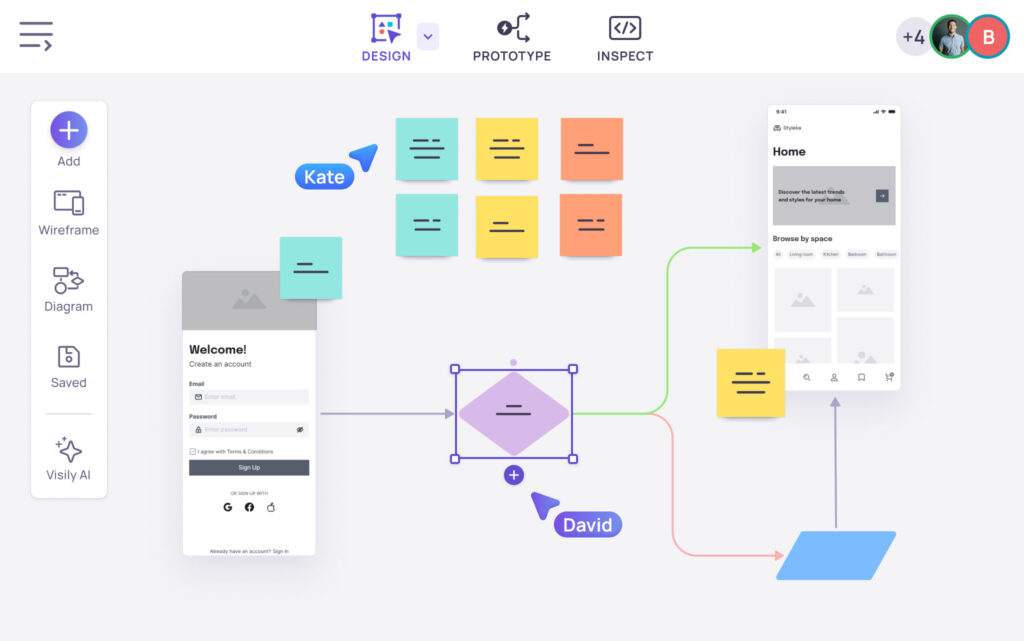
Diagramming isn’t necessarily a solitary task. In fact, collaborating on diagrams with your team can lead to more comprehensive and diverse ideas. Visily provides a big canvas where every team member can actively contribute and share ideas in real time.
Features like sticky notes and comments empower team members to add their insights and feedback onto the diagram directly. Additionally, the intuitive drag-and-drop functionality simplifies the process of arranging and organizing diagram elements. So, whether you’re brainstorming new product features or planning your next project, collaborative diagramming can make the process more efficient and inclusive.
Summary
We’ve embarked on a journey through the world of diagram templates, exploring the various types available, the importance of selecting the right template, and the role of design in creating engaging diagrams. We delved into key diagram templates every product manager should know and the importance of customization to meet unique business needs. We also touched on the power of collaboration in creating effective diagrams.
In a nutshell, diagram templates are a game-changer in product management. They streamline communication, facilitate decision-making, aid in problem-solving, and boost efficiency. So, whether you’re a seasoned product manager or just starting out, mastering the art of diagramming with the right templates can be a significant asset in your product management toolkit.


